


















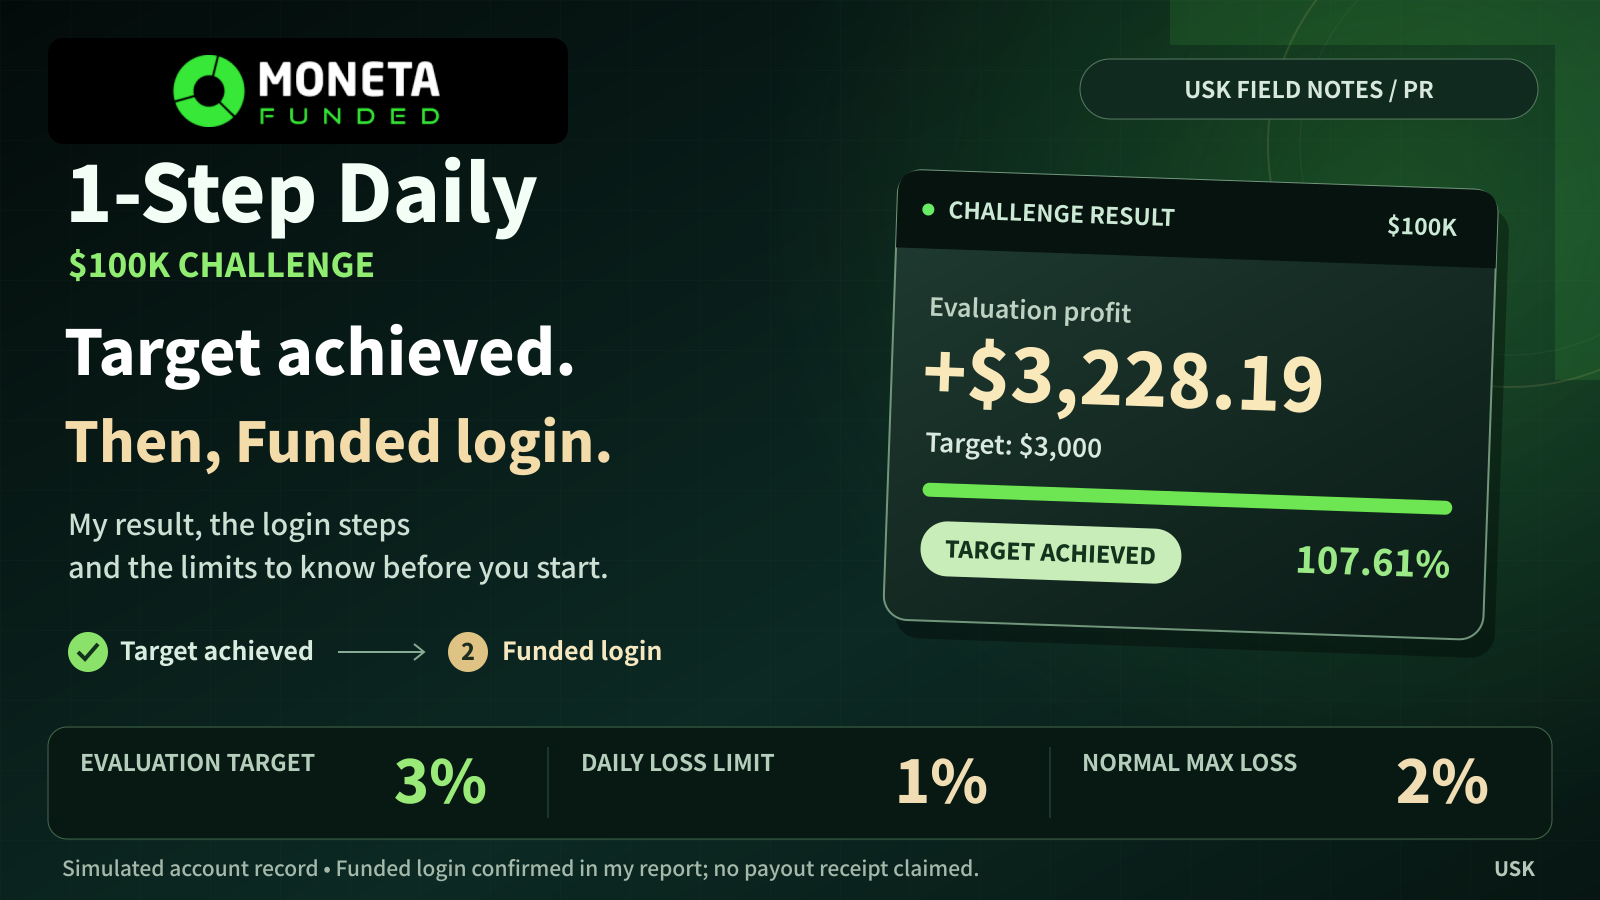

This article covers Moneta Funded’s 1-Step Daily. It is a separate product from the standard 1-Step and Instant Pro.
I separate my screenshots and account experience from the current official rules checked on November 6, 2026. Names and account identifiers have been removed from the images. My experience covered here ends at Funded login; this is not a payout or receipt-of-funds report.
Affiliate disclosure: This article contains Moneta Funded referral links. The site may receive a commission if you purchase through them.
Update history
November 7, 2026: Added the Funded floating-loss controls and the distinction from standard 1-Step.
November 8, 2026: Added account prices, code-applied displays, fee-recovery illustrations, the post-first-payout buffer and risk-management examples. Models are separated from official terms and my experience.
November 9, 2026 (Japan time): Added a beginner money-flow guide, clearer fee-recovery tables, A/B/C calculation walkthroughs and probability pie charts.
November 9, 2026 (Japan time, addendum): Split the expected-value table into first-payout amounts (profit needed, first withdrawal, cash received and buffer kept) and two horizons, “stop after the first receipt” and “repeat until failure,” and added a mean return ratio (payout-ratio style). Amount positions in the Company F comparison table were also tidied. Model assumptions and probabilities are unchanged.
November 9, 2026 (Japan time, addendum 2): Added a hypothetical model that applies the same assumptions to Moneta $50K and an anonymous Company F standard $20K account, and placed mean cash and mean return ratio next to the probability pie charts. This helps read probability and mean together; existing probabilities and means are unchanged. These are not actual results or success probabilities.
November 9, 2026 (Japan time, addendum 3): Rewrote the conclusion to set out the fee, target and limits of the hypothetical calculations. The A–C figures are unchanged.
November 9, 2026 (Japan time, addendum 4): Removed the additional first-receipt-only example and the pie charts. The first-receipt probabilities, mean cash and mean return ratios remain as a numeric summary, and the existing A–C figures, assumptions and loss-risk explanations are unchanged.
November 9, 2026 (Japan time, addendum 5): Added, below the numeric summary, why Cases B and C have a mean return ratio above 100% even though about 80% of paths receive nothing (zero receipts 82.22% and 86.67%; mean return ratios 275.43% and 330.52%). Model assumptions and figures are unchanged.
New to prop accounts? Start with the money flow
$100K does not mean depositing $100,000 yourself. It is the account size used to calculate trading performance and loss limits. What you pay initially is the purchase fee; the account balance is not cash you can simply withdraw.
- Buy access to the evaluation, or Challenge. This is the testing stage: pursue the profit target while following the rules. Evaluation profit is not treated here as cash rewards you can receive.
- After passing and completing the checks, move to Funded. This is the stage where you trade within the rules and seek rewards from eligible profits. Passing alone does not recover your purchase fee.
- Request a reward, then receive it after approval and payment. Keep the amount debited from the account separate from the cash you receive. This article’s model assumes the latter is 88% of the former; the actual breakdown must be checked on the request screen.
- Continue with the buffer left in the account. The buffer is the gap between the balance and the loss floor that would cause failure. DD, short for drawdown, means a decline in balance or equity; here we also check the permitted decline. The separate daily limit still applies. Taking a larger reward can leave less buffer.
1. My result: $3,228.19 against a $3,000 target
The program shown is 1-Step Daily / $100,000 Challenge / MetaTrader 5.
| Item shown | Value |
|---|---|
| Start date | October 29, 2026 |
| Account size | $100,000 |
| Profit target | $3,000 |
| Balance at the recorded result | $103,228.19 |
| Equity at the recorded result | $103,228.19 |
| Difference from initial balance | +$3,228.19 |
| Target completion | 107.61% |
That is approximately +3.23% of the initial account size, $228.19 above the target. The dashboard also marked the profit target as achieved.
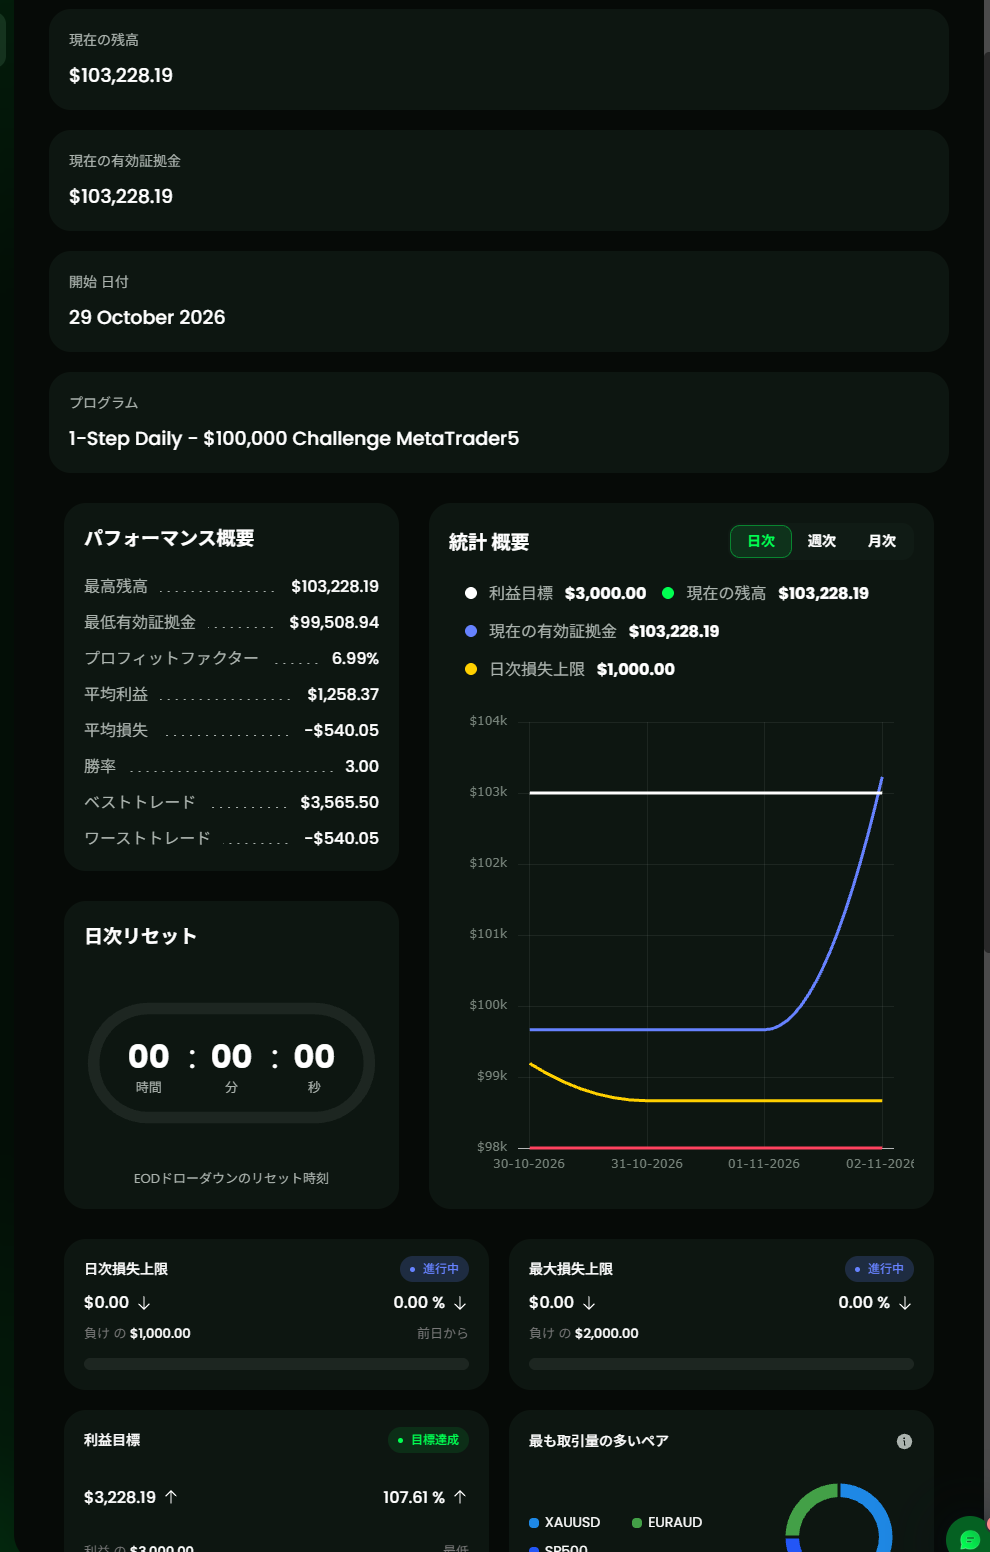
My Challenge dashboard. The identifying header was cropped out; the figures and chart were not redrawn. These are simulated account figures, not an amount of cash received.
The target-achievement email displayed November 2 as its receipt date. It asked me to close trades and complete identity verification if needed.
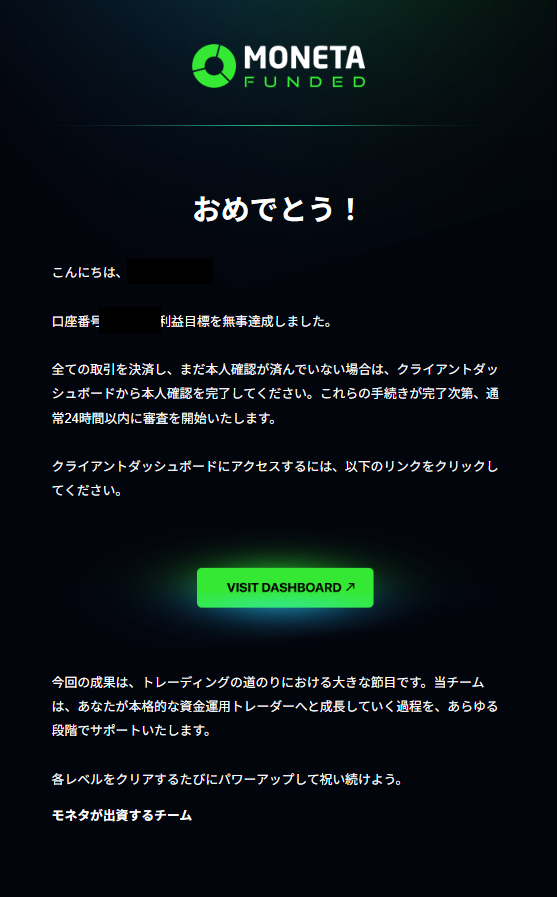
The email body, with identifying details removed. Its reference to normally starting review within 24 hours concerns the review starting after the required steps. It is not a promise of Funded activation or payment within 24 hours.
The start date and notification date are visible, but these images do not establish the number of trading days or a full trade-by-trade history. I am not presenting this as a four-trading-day pass.
2. I checked the email again before Funded login worked
After the Funded account instructions arrived, I entered the details into MT5, but initially could not use the account. I checked the email again, found the agreement step, and reported that I could log in after completing it.
That is the sequence described in my post. The practical lesson from this particular experience was to check for remaining steps in the email, not just the login details.
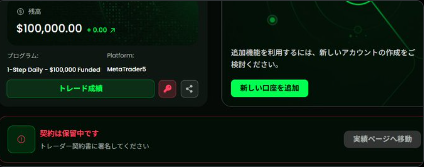
This image also still shows a contract-pending message. The screenshot and the successful-login report in the post cannot be treated as the same moment, so I do not label it a screenshot taken after agreement completion.
The official process also includes agreement, identity verification and a trading review. Additional review can extend the process, so my sequence should not be treated as a guaranteed timeline. Official post-Challenge process
3. The current 1-Step Daily conditions
These are the official conditions checked on November 6, 2026, not a complete reconstruction of the terms attached to my purchase date. Check the dashboard and agreement for your own account configuration.
| Item | 1-Step Daily |
|---|---|
| Evaluation | One phase |
| Evaluation profit target | 3% of the initial balance |
| Daily loss allowance | 1% of the initial balance |
| Normal maximum loss | 2% of the initial balance, static |
| Minimum profitable days | Listed as none |
| Consistency rule | Listed as none |
| Time limit | Unlimited, subject to inactivity rules |
| Leverage | Up to 1:30, depending on instrument |
| Funded profit split | 88% |
| Payout schedule | Daily when eligible |
| Maximum single request on $100K | $2,000 |
The target is based on closed balance, and positions must be closed. News-trading restrictions and general prohibited-method rules still apply. No consistency rule does not mean unrestricted trading.
The 3% target and single evaluation stage make the goal straightforward to understand. Trading still needs to fit within the 1% daily and normal 2% maximum-loss limits. Whether that feels manageable depends on your usual stop sizes and trading frequency. The hypothetical probabilities later in this article are not actual pass rates or a direct measure of account difficulty.
4. Account sizes and prices with 50% or 42% off
1-Step Daily has $50K, $100K and $200K sizes. Standard 1-Step and Instant Pro are separate products, so their fees should not be mixed into this table.
On November 8, 2026 at 14:07 UTC, the official pre-purchase selector was checked with 1-Step Daily / MT5, first without a code and then with USK and USK42. No order was created and no payment was made.
| Account size | No code | USK · 50% | USK42 · 42% |
|---|---|---|---|
| $50,000 | $142 | $71 | $82 |
| $100,000 | $284 | $142 | $165 |
| $200,000 | $568 | $284 | $329 |
The discount calculation is regular fee × (1 − discount rate). For $100K, 50% off gives $284 × 0.50 = $142; 42% off gives $284 × 0.58 = $164.72. A 42% discount means paying the remaining 58%, not paying 42%.
USK showed 50% off. Applying exactly 42% off mathematically gives $82.36, $164.72 and $329.44; the selector instead displayed the whole-dollar amounts $82, $165 and $329 shown above. The fee examples below use the observed display amounts. They do not establish the final invoice including taxes, payment fees or currency conversion. Official plan and price selector
The earlier guidance was USK for first purchases at 50%, and USK42 for repeat purchases at 42%. The current check establishes the code-applied display only. The definition of a first purchase, usage limits, expiry, stacking and individual account eligibility remain unconfirmed. Check your own selected product and final total before purchasing.
Swipe the table sideways to see every column.
| Account | 3% target | 1% daily | 2% normal max loss | Single-request cap |
|---|---|---|---|---|
| $50,000 | $1,500 | $500 | $1,000 | $1,000 |
| $100,000 | $3,000 | $1,000 | $2,000 | $2,000 |
| $200,000 | $6,000 | $2,000 | $4,000 | $4,000 |
The 1% is the daily loss allowance, while 2% is the normal maximum-loss allowance from the initial balance. The daily-level calculation, floating-loss controls and payout lock need separate attention. A request cap is not necessarily the amount received in cash. Official Daily sizes and conditions
Doubling the nominal size roughly doubles the target, dollar loss allowances and fee. A larger account is not automatically a better deal; compare the fee you can afford to lose with your normal risk per trade.
5. Benefits: a clear target and frequent request opportunities
One evaluation phase and a 3% target
The $100K target is $3,000. There is one evaluation phase rather than several targets in sequence. That gives the evaluation a clear endpoint, but does not establish that passing is easy: the loss allowances are also small.
No minimum profitable days or best-day percentage requirement
The current dedicated conditions list neither requirement. This removes the need to add trades solely to accumulate qualifying days or dilute the best day’s share of profit. Loss controls and review requirements remain.
The normal maximum-loss level does not trail account gains
For $100K, the normal level is $98,000. It does not move up merely because the account earns profit. Payout approval triggers a separate lock, explained below. Official static maximum-loss explanation
Daily requests when eligible
The shorter request cycle can matter to traders who prefer frequent opportunities to request earned rewards. It does not mean guaranteed daily profits or same-day receipt.
6. Drawbacks and limits: 1% per day and the post-payout buffer
A $100K account still has a $1,000 daily allowance
A large nominal account size does not give unlimited room for losses. A strategy with large position sizes or wide losses per trade can approach this allowance quickly.
At the daily 22:00 UTC snapshot, the higher of balance or equity is used, then the $1,000 allowance is subtracted. That is 07:00 JST on the following calendar day. The daily breach level is not permanently fixed at $99,000.
For example, a $102,000 snapshot value gives a $101,000 daily level. Floating profits carried across the reset can therefore affect the next day’s limit. Official daily-loss calculation
Funded accounts also have symbol and trade-idea floating-loss controls
The official guidance checked on November 7, 2026 says floating loss of 2% of the account size on the same symbol triggers a warning and restrictions on a 1-Step Daily Funded account. All open trades on that account are closed automatically, and new trading is paused until the next daily reset. The account is also moved to a 1.5% floating-loss limit per symbol or trade idea. Exceeding 1.5% after that restriction is applied breaches the affected account.
This initial warning does not waive the separate 1% daily or normal 2% maximum-loss rules. Daily’s daily-loss limit still applies. The revised standard 1-Step has a different 1% floating-loss rule with an immediate breach; that rule does not apply to 1-Step Daily. Keep the two plans and these separate limits distinct. Official Funded floating-loss controls / Official 1-Step Daily scope
Payout approval locks maximum loss at the initial balance
The current FAQ says approval, rather than completion of the transfer, locks the maximum-loss level at the original starting balance: $100,000 on a $100K account.
Do not assume the normal $98,000 level continues after a payout. Check both the requested amount and the balance that will remain above $100,000 after deductions. Official payout lock
The maximum-loss level locks at the initial balance; the account balance itself does not automatically reset to the initial amount. In the official example, a $100K account at $103,000 has a $2,000 payout approved and is left with a $101,000 balance, while its maximum-loss level locks at $100,000. The difference is $1,000. The relationship between the example’s $2,000 and the post-split cash receipt needs separate confirmation.
If all profit is deducted and balance approaches $100,000, little or no room remains to continue trading. A higher daily loss level can restrict usable room further. Check balance, daily level and maximum-loss level together before and after a request.
Daily requests still have a cap and a review
The single-request maximum on $100K is $2,000. Positions must be closed, identity checks completed and the request reviewed. The usual processing estimate is 24–48 business hours, excluding weekends and international public holidays; additional checks can take longer. Official Daily payout rules
The +$3,228.19 shown here is a Challenge result. Multiplying it by 88% would not establish a reward I actually received.
The participation fee and failure risk remain
These are simulated accounts, not a cash allocation of $100,000 to the trader. Participation costs money, rule breaches can end the account, and refunds have conditions. Check the total cost and rules rather than choosing solely on a discount. Official terms
7. How much profit would recover the purchase fee?
A recovery ratio is different from a recovery probability
With purchase fee C and rewards actually received R, fee recovery ratio = R / C × 100%. The net return on the fee is (R − C) / C × 100%. A 100% recovery ratio matches the purchase fee; the excess is positive after that fee. Neither ratio tells you the probability of recovering it.
The following is arithmetic assuming the receipt equals 88% of eligible profit. Account deductions, requested amounts and cash received are not necessarily identical. The public FAQs do not fully settle how those labels relate, so check the actual deduction and receipt breakdown on the request screen.
Read this table as “fee paid → profit needed to cover that fee → ratio if cash is received.” The recovery ratio compares cash received with the fee paid. It is not a probability of success.
Swipe the table sideways to compare all three cases.
| Measure | No code | USK | USK42 |
|---|---|---|---|
| Purchase feeC | $284 | $142 | $165 |
| Profit needed to cover feeC / 0.88 (assumed) | $322.73 | $161.37 | $187.50 |
| If $440 is receivedReceipt / fee × 100 | 154.9% | 309.9% | 266.7% |
“Profit needed to cover fee” works backwards under the assumption that you receive 88% of that profit. Minimum requests and review requirements apply separately, so reaching this profit does not necessarily make a payout possible. The final row is a comparison conditional on already having received $440.
Required eligible profit is rounded up to the next cent so the calculated receipt does not fall below the fee.
For a $100K purchase at the observed USK price of $142, $142 / 0.88 gives approximately $161.37 of eligible profit as the mathematical fee-recovery threshold. In a separate example, receiving $440 from $500 of eligible profit gives about 309.9% recovery, a $298 net gain after the fee, and about 209.9% net return on the fee. The $500 is a hypothetical Funded result, not a cash-out of my Challenge profit.
Written step by step, that example is $500 × 0.88 = $440, then $440 / $142 × 100 ≈ 309.9%. After subtracting the purchase fee, the percentage is ($440 − $142) / $142 × 100 ≈ 209.9%.
Minimum requests are a separate condition. The Daily overview lists a usual $100 minimum and $500 for Rise; the payout-specific guide explicitly states a $100 Crypto minimum. Which pre- or post-split amount the minimum applies to needs checking on the request screen, so the table is not a guarantee that a request can be made at that profit. Official Daily payout guide / Official Daily overview, including Rise minimum and refund terms
The registration-fee refund is described as occurring after the fourth successful payout on the same account, not automatically at the first payout. No refund is added to the calculations below. Repurchases add more fees, while taxes, conversion and payment costs can change actual recovery.
Expected value changes with the assumed success probability
For a one-off example, let p be the probability of receiving $440, with no receipt otherwise. Expected net result = p × $440 − purchase fee. With a $142 fee, an assumed 20% probability gives −$54, while 40% gives +$34. Break-even is about 32.27%. These are illustrative probabilities, not Moneta’s published pass rates or estimates from my trading record.
Repeated rewards also depend on how much is withdrawn and how much buffer is retained. The next table is a hypothetical model showing that structure. It is not an estimate of real expected earnings, a purchase recommendation or an invitation to exploit the rules statistically.
- $100K account and $142 fee. Evaluation passes at +$3,000 or fails at −$2,000.
- Independent 50/50 closed outcomes of +$500 or −$500, with no commission, spread or slippage. Targets and loss levels lie on the $500 grid.
- One trade per day, flat at the daily reset, and no intratrade adverse move beyond the final loss. No trading while a payout is pending.
- Funded begins with a $2,000 downside allowance. The initial profit target is retained buffer B plus debit W; later cycles retain B and deduct the same W.
- Receipt is assumed to be 0.88 × W, all requests are approved, and daily levels are assumed to accommodate the deduction without an adverse conflict. Equivalence between W and the request-cap amount is unconfirmed.
- Unlimited horizon, continuing until failure, no repurchase. No refund, taxes, FX costs, additional fees or cost of waiting.
A, B and C are not account tiers. They are three examples of how much profit to build and how much to leave in the account. Section 1 sets out the first-payout amounts; section 2 shows results if you stop after the first receipt, and section 3 if you repeat until failure. The variable B means retained buffer and is separate from the name “Case B.”
Swipe the table sideways to compare all three cases.
| Measure | Case A | Case B | Case C |
|---|---|---|---|
| 1. First payout: how much to build, take out and keep? | |||
| Total profit neededAfter Funded · B + W | $1,500 | $2,500 | $4,000 |
| First withdrawal (before split, assumed)W: amount leaving the account | $500 | $1,500 | $2,000 |
| Cash you receive (88% assumed)W × 0.88 | $440 | $1,320 | $1,760 |
| Buffer left in accountB: above the loss floor | $1,000 | $1,000 | $2,000 |
| If reached: cash − feeSuccess case only; not expected value | $298 | $1,178 | $1,618 |
| 2. If you stop after the first receipt | |||
| Purchase → first receiptProbability, including evaluation | 22.86% | 17.78% | 13.33% |
| Mean receiptFirst only; includes zero | $100.57 | $234.67 | $234.67 |
| Mean after purchase feeMean receipt − $142 | −$41.43 | +$92.67 | +$92.67 |
| Mean return ratio (payout-ratio style)Mean receipt / $142 × 100 | 70.82% | 165.26% | 165.26% |
| 3. If you repeat until failure (unlimited time) | |||
| Mean total receiptsUnlimited time; includes zero | $301.71 | $391.11 | $469.33 |
| Mean after purchase feeMean total receipts − $142 | +$159.71 | +$249.11 | +$327.33 |
| Mean return ratio (payout-ratio style)Mean total receipts / $142 × 100 | 212.47% | 275.43% | 330.52% |
Note on section 1: total profit needed = buffer left in the account + first withdrawal (before split), and the first withdrawal before split = cash received + the 12% not paid out. For C, $4,000 = $2,000 (buffer) + $1,760 (cash) + $240 (12% share); for A, $1,500 = $1,000 + $440 + $60; for B, $2,500 = $1,000 + $1,320 + $180. The withdrawal does not reset the account balance to $100,000. The model assumes the loss floor locks at the initial $100,000 and the buffer remains above it. Whether the first withdrawal, the amount leaving the account and the cash received officially correspond this way is an unverified assumption. “If reached: cash − fee” applies only when the first receipt is reached; it is not an expected value.
Mean return ratio (payout-ratio style) = mean receipt including zero-receipt outcomes / $142 purchase fee × 100. It is neither a win rate nor a recovery ratio for successful accounts only. Exactly 100% means that, under these assumptions, the average receipt only matches the fee; above 100% the average is positive and below 100% it is negative. It does not guarantee any individual result.
The horizon changes the ratio substantially for the same A, B and C. Stopping after the first receipt (section 2) gives about 70.82%, 165.26% and 165.26%; repeating until failure (section 3) gives about 212.47%, 275.43% and 330.52%. Case A is below 100% on a first-receipt-only basis but above it in section 3. Section 3 assumes continuing indefinitely unless the account fails; in practice, waiting, reviews, costs and rule changes intervene.
“Mean total receipts” averages all paths, including zero receipts and repeated receipts. It is not a forecast of what a typical person will receive. In all three cases, the median receipt (the middle result when ordered by size) is $0, and the median after the fee is −$142. Refunds, taxes, currency conversion and extra costs are excluded.
How the daily loss line is adjusted around a payout has not been officially confirmed. These calculations assume that a withdrawal does not cause a rule breach and that trading can continue afterward under the same assumptions. This is not evidence that this way of operating works in a real account. Also, the “total profit needed” in section 1 is profit built in the Funded account. The +$3,000 evaluation target is only a pass condition; it is not profit you can withdraw.
First-receipt probability in figures, with mean cash and return ratio
Look at two things together. The upper rows give the probability of reaching the first receipt from purchase, and of not reaching it. The figures below them are the mean cash and mean return ratio if you repeat until failure, including paths with zero receipts. A high mean return ratio does not mean that share of people receive anything.
These are not actual customer results. Each case represents 100% of paths from buying one account. All assumptions above apply: independent ±$500 outcomes at 50% each, no trading costs, unlimited time and approved receipts.
Case A
- First receipt reached
- 22.86%
- No first receipt (includes evaluation failure)
- 77.14%
- Lifetime mean cash if repeating until failure (unlimited time, includes zero)
- $301.71
- Mean return ratio (mean total cash / $142 fee); not a probability
- 212.47%
- For contrast: mean return ratio if you stop after the first receipt
- 70.82%
Case B
- First receipt reached
- 17.78%
- No first receipt (includes evaluation failure)
- 82.22%
- Lifetime mean cash if repeating until failure (unlimited time, includes zero)
- $391.11
- Mean return ratio (mean total cash / $142 fee); not a probability
- 275.43%
- For contrast: mean return ratio if you stop after the first receipt
- 165.26%
Case C
- First receipt reached
- 13.33%
- No first receipt (includes evaluation failure)
- 86.67%
- Lifetime mean cash if repeating until failure (unlimited time, includes zero)
- $469.33
- Mean return ratio (mean total cash / $142 fee); not a probability
- 330.52%
- For contrast: mean return ratio if you stop after the first receipt
- 165.26%
In these three cases, one assumed receipt exceeds the $142 fee, so the “first receipt reached” probability also equals the fee-recovery probability. Receipt = account debit W × 88% is a modelling assumption; the actual relationship between debit, requested amount and cash received remains unverified.
The “first receipt reached” and “no first receipt” figures are probabilities. Mean cash ($301.71, $391.11, $469.33) and mean return ratios (212.47%, 275.43%, 330.52%) average over all paths including zero receipts; they are not probabilities. The 309.9% in the earlier example applies only if $440 is received, so it is a different figure from these mean ratios. A/B/C are illustrative cases with different buffers and debits, not official plan names.
Why the mean return ratio can top 100% even when more than 80% of paths receive nothing
Cases B and C are about balancing the cash you receive against the buffer you keep, not only about reaching the first payout.
- Case B: zero receipts 82.22% / mean return ratio if repeating until failure 275.43%
- Case C: zero receipts 86.67% / mean return ratio if repeating until failure 330.52%
Even with those zero-receipt paths included in the average, this hypothetical model stays above 100%. The formula is mean receipts / $142 fee × 100 (Case B: $391.11 / $142 × 100 ≈ 275.43%; Case C: $469.33 / $142 × 100 ≈ 330.52%). If you stop after the first receipt, both are 165.26% ($234.67 / $142 × 100); that is a different horizon.
What lifts the mean is a less common, larger receipt. If the first receipt is reached, it is $1,320 for B and $1,760 for C, and some of those paths keep receiving afterward, but only 17.78% and 13.33% of paths get there. Most paths receive nothing and, in this model, lose the $142 fee.
These are model calculations that assume 50/50 outcomes, no trading costs, unlimited time and every payout approved. The ratios already include the zero-receipt paths; they are not ratios for accounts that reached a payout, success rates or actual results, and they do not show a real trading edge.
If you are considering a B- or C-style split, check the actual conditions first and keep the buffer within your normal risk rules. Aiming for these percentages does not make the purchase advantageous.
In this simple model, the evaluation arrival probability is 2 / (2 + 3) = 40%. The probability from purchase to the first receipt multiplies that by 2,000 / (2,000 + B + W). Afterward, the probability of reaching the next debit is B / (B + W). Mean receipt in section 3 of the table (unlimited repetition until failure) is first-arrival probability × (0.88 × W) / (1 − next-arrival probability).
Following Model A from purchase, step by step
Take just A from the table and connect the numbers. Every assumption above still applies, including independent ±$500 outcomes at 50% each, zero trading costs and an unlimited horizon.
- Start with the probability of passing evaluation. Counting $500 as one step, failure is four steps down and passing is six steps up. The target is farther away, so a 50% per-trade win rate does not imply a 50% pass rate. Including paths with mixed wins and losses, the probability of reaching the upper boundary first is 4 / (4 + 6) = 40%. This is not a comparison of four consecutive losses with six consecutive wins.
- The first Funded target is $1,500. Add the $1,000 retained buffer B and $500 debit W. Conditional on passing evaluation, the chance of reaching that target before losing the $2,000 downside room is 2,000 / (2,000 + 1,500) = 4 / 7, about 57.14%. From purchase, include evaluation: 0.4 × (4 / 7) ≈ 22.86%.
- After the first receipt, use the retained $1,000. A $101,000 balance is $1,000 above the initial-balance loss floor of $100,000. The next-cycle chance of reaching +$500 first is 1,000 / (1,000 + 500) = 2 / 3, about 66.67%. This is conditional on already reaching the first receipt, not the probability that a purchaser recovers the fee. The actual daily loss limit still applies separately.
- Add the receipts across cycles to get a $301.71 mean. Each assumed receipt is $500 × 0.88 = $440. Adding the first, second, third and later receipts multiplies first-receipt probability × $440 by 1 + 2/3 + (2/3)² + … . That sum is 3, so 0.4 × (4 / 7) × $440 × 3 ≈ $301.71, including paths with no receipt. Subtracting the $142 purchase fee gives mean net proceeds of about +$159.71.
Intermediate calculations use unrounded values. Because one assumed $440 receipt already exceeds the $142 fee, the probability of recovering the fee equals the roughly 22.86% probability of reaching the first receipt from purchase. Do not read 66.67% as the purchase recovery probability, or $301.71 as an amount to expect every time. This is not a forecast based on real results, reviews and costs; the relationship between the debit and actual receipt also remains an assumption.
Model B: the same buffer, a larger debit
B keeps the same $1,000 buffer as A but raises the assumed debit to $1,500. The shared assumptions, including the 40% evaluation pass probability, do not change.
- The first profit target is $2,500. B + W = $1,000 + $1,500. The assumed Funded balance reaches $102,500, then a $1,500 debit leaves $101,000. That is a $1,000 buffer above the $100,000 loss floor.
- The probability of reaching the first receipt from purchase is about 17.78%. Conditional on passing evaluation, it is 2,000 / (2,000 + 2,500) = 4/9, or about 44.44%. From purchase, multiply by the 40% evaluation probability: 0.4 × (4/9) ≈ 17.78%. The larger first target makes this lower than A’s approximately 22.86%.
- The assumed receipt is $1,320 and the conditional repeat probability is 40%. The receipt is $1,500 × 0.88. After the first debit, a $1,000 buffer is used to reach the next +$1,500, giving 1,000 / (1,000 + 1,500) = 0.4. The lifetime mean is 0.4 × (4/9) × $1,320 / (1 − 0.4) ≈ $391.11. Subtracting the $142 fee gives approximately +$249.11.
Model C: a larger buffer and a larger debit
C assumes a $2,000 retained buffer and a $2,000 debit per receipt. Keeping more buffer also increases the profit needed before the first receipt.
- The first profit target is $4,000. B + W = $2,000 + $2,000. A $2,000 debit from $104,000 leaves $102,000, or $2,000 above the locked $100,000 loss floor. This models an account debit; it does not establish that W means the same amount as the official request cap.
- The probability of reaching the first receipt from purchase is about 13.33%. Conditional on passing evaluation, it is 2,000 / (2,000 + 4,000) = 1/3, or about 33.33%. Including the 40% evaluation probability gives 0.4 × (1/3) ≈ 13.33%. Using 33.33% from purchase would omit the paths that fail evaluation.
- The assumed receipt is $1,760 and the conditional repeat probability is 50%. The receipt is $2,000 × 0.88. A $2,000 retained buffer is used to reach the next +$2,000, so 2,000 / (2,000 + 2,000) = 0.5. The lifetime mean is 0.4 × (1/3) × $1,760 / (1 − 0.5) ≈ $469.33. Subtracting the fee gives approximately +$327.33.
The first assumed receipt in B and C also exceeds the $142 fee, so their fee-recovery probabilities under these assumptions are approximately 17.78% and 13.33%. C has the largest mean receipt but the lowest chance of reaching the first receipt among these three cases. A larger mean alone does not identify a better trading strategy. Every result includes zero-receipt paths and remains a hypothetical calculation, not an actual success rate.
If the process stops after the first receipt, mean receipts are only about $100.57 for A and $234.67 for B or C (section 2 of the table). Section 3 instead allows repeated cycles until failure over an unlimited horizon, so it is not the first-receipt-only expected value in section 2.
All three cases have a $0 median receipt and a −$142 median net result. A positive mean can coexist with most outcomes losing the fee because a minority of long-lasting paths lift the average. Mean receipts divided by the fee are about 212.5%, 275.4% and 330.5%, but fee-recovery probabilities here are about 22.86%, 17.78% and 13.33%. Each assumed first receipt exceeds $142, so recovery probability equals first-arrival probability in these particular examples.
Real win rates, payoff sizes, floating-loss paths, review outcomes and costs change the result. Multiple purchases require adding all purchase fees. Estimating actual expected value or recovery probability requires strategy-specific trading records and current request mechanics.
How does it compare with Company F at the nearest available size?
The comparator is anonymised as “Company F,” including its specific product names. This comparison concerns its crypto perpetual-futures account, not a separate CFD product. There is no shared account size, so we use the nearest pair among the sizes actually offered: Moneta $50K and Company F’s standard $20K. The face values differ by 2.5 times; these are not same-size, same-market accounts. We do not combine multiple accounts under unverified rules. This is a separate size comparison from the $100K model above.
Swipe the table sideways, or focus it and use the arrow keys, to see both companies.
| Condition | Moneta 1-Step Daily | Company F · standard |
|---|---|---|
| Account size | $50,000 | $20,000 |
| Regular displayed fee | $142 | $258 |
| Displayed price at 50% off (Moneta: USK-applied display) | $71 | $129 |
| Evaluation profit target | $1,500 3% of account | $1,800 9% of account |
| Daily loss allowance | $500 1% of account | $600 3% of account |
| Normal maximum-loss allowance before first reward approval | $1,000 2% of account | $600 3% of account |
| Initial reward share | 88% | 80% |
Under the checked conditions, Moneta is lower on the purchase fee (USK-applied display, conditional) and on the evaluation profit target as a share of the account (3% vs 9% of account). The normal maximum-loss allowance before first reward approval is $1,000 for Moneta and $600 for Company F in dollars, but only because Moneta’s account is 2.5 times larger. As a share of the account, the maximum loss is 2% for Moneta versus 3% for Company F, and the daily allowance is 1% versus 3% ($500 versus $600), so Company F is wider on both. Account size scales cash amounts while probabilities depend on the ratio of loss allowance to target, so the larger dollar maximum loss is not counted as an independent advantage. Not every condition favours Moneta.
Both lock the maximum-loss floor to the initial account amount when the first reward is approved. The account balance itself is not reset to its initial amount. The remaining buffer then depends on the profit left in the account, so the pre-first-reward-approval allowances in the table must not be carried forward unchanged after a reward.
Company F also has an upper tier with a 5% maximum-loss allowance, or $1,000 on $20K. That matches the normal dollar allowance on Moneta $50K, but its price is unverified: the standard $129 price must not be applied to the upper tier. Company F also describes reward shares of 80% for the first four approved performance rewards, 85% for the fifth and 90% from the sixth onward. Initial shares alone do not determine the comparison over the full account life.
Company F permits news trading in its guidance, whereas Moneta has a five-minute restriction on each side of relevant releases. Markets, fees, price movement, daily-loss measurement and review also differ. Company F’s official fee descriptions are inconsistent, so they are not used for a cost-adjusted expected-value comparison. The earlier $100K A/B/C model is a separate Moneta-only illustration; the $50K and $20K calculation that follows applies the same assumptions to hypothetical paths. Neither is a comparison with Company F’s actual performance or success probabilities.
Prices are displayed amounts at the time checked, not guarantees of discount eligibility, expiry, stacking or final totals including tax and payment fees. Moneta’s Daily / MT5 selector was checked on November 8 at 23:07 Japan time; the other side was checked against official pricing and help material on November 9 at 00:40 Japan time. Identifying links are omitted to preserve the requested anonymity.
Calculated on the same assumptions, how does it differ from Company F?
The earlier $100K A/B/C model is a separate Moneta-only calculation. Below, the same assumptions are expressed as shares of each account and applied to the actually offered $50K and $20K sizes as hypothetical paths. The results are a hypothetical-model comparison, not actual results or success probabilities.
Assumptions first. What follows is a hypothetical model that applies the same assumptions to both companies, not actual results.
Key premise: The model assumes that the gross debit W times the share equals the cash received, that every payout is approved and that no daily-floor conflict arises. In practice, Moneta's Case B and C withdrawals ($750 and $1,000) can exceed its $500 daily loss allowance, and how the daily and other thresholds are actually adjusted during a payout is unverified. This is not an executable strategy and not actual probabilities.
Maximum-loss floor: when the first reward is approved, the maximum-loss floor moves up to the initial balance and is fixed there. The account balance is NOT reset to the initial amount. The continuation probability r = B / (B + W) depends on that treatment (a buffer of B remaining above the fixed floor) and on the daily-floor simplification that the daily line never obstructs the buffer after a withdrawal.
- Accounts compared: Moneta $50,000 (USK-applied display $71: the pre-purchase selector amount after applying the USK code, conditional on eligibility; no promise that the code is active or when it expires, and taxes and payment fees in the final total are unverified) and Company F's standard crypto perpetual-futures account $20,000 (displayed $129). CFD products and the 5%-loss upper tier are not mixed in.
- These are model outputs, not actual results or success rates.
- Fair daily ±0.5%: each day the account moves +0.5% or −0.5% of its size, independently at 50% each, with no costs, no adverse intraday excursion beyond the closed loss and no position at the daily reset.
- The average covers all paths, including those with zero receipts, continuing without a time limit until failure. All withdrawals are assumed approved and not to conflict with the daily limit.
- The earlier $100K / $142 A/B/C model is a separate calculation. The $50K and $20K figures below apply the same assumptions (A/B/C with the buffer and withdrawal expressed as shares of each account). Refunds, repurchases, taxes, FX and waiting costs are excluded.
Under the same assumptions, Moneta's mean return ratio is higher than this Company F standard account. The main differences are the USK-applied displayed fee and the lower evaluation target as a share of the account.
However, the daily loss allowance and the market are not the same, whether such payouts would actually be approved is unverified, and a mean return ratio is not a probability.
Case A: buffer 1% of the account, gross withdrawal 0.5%
In dollars: Moneta buffer $500 and withdrawal $250; Company F buffer $200 and withdrawal $100.
Swipe the table sideways to see both companies.
| Measure | Moneta $50,000 · USK-applied $71 | Company F · standard $20,000 · displayed $129 |
|---|---|---|
| Model mean return ratioMean total cash / fee × 100 | 212.47% | 31.65% |
| Expected total cashIncludes zero | $150.86 | $40.82 |
| Net after feeMean total cash − one fee | +$79.86 | −$88.18 |
| Fee-recovery probabilityModel probability, not observed | 22.86% | 11.11% needs 2 receipts |
If you stop after the first receipt, the mean net result is −$20.71 for Moneta and −$115.67 for Company F. Case A is negative for both companies if you stop after the first receipt.
Case A: see the stop-after-first-receipt figures
| Measure | Moneta | Company F · standard |
|---|---|---|
| Mean receiptFirst only; includes zero | $50.29 | $13.33 |
| Net after feeMean receipt − one fee | −$20.71 | −$115.67 |
| Mean return ratioMean receipt / fee × 100 | 70.82% | 10.34% |
Case B: buffer 1% of the account, gross withdrawal 1.5%
In dollars: Moneta buffer $500 and withdrawal $750; Company F buffer $200 and withdrawal $300.
Swipe the table sideways to see both companies.
| Measure | Moneta $50,000 · USK-applied $71 | Company F · standard $20,000 · displayed $129 |
|---|---|---|
| Model mean return ratioMean total cash / fee × 100 | 275.43% | 42.38% |
| Expected total cashIncludes zero | $195.56 | $54.67 |
| Net after feeMean total cash − one fee | +$124.56 | −$74.33 |
| Fee-recovery probabilityModel probability, not observed | 17.78% | 13.64% |
If you stop after the first receipt, the mean net result is +$46.33 for Moneta and −$96.27 for Company F. In Case B, even stopping after the first receipt gives a positive mean for Moneta and a negative one for Company F.
Case B: see the stop-after-first-receipt figures
| Measure | Moneta | Company F · standard |
|---|---|---|
| Mean receiptFirst only; includes zero | $117.33 | $32.73 |
| Net after feeMean receipt − one fee | +$46.33 | −$96.27 |
| Mean return ratioMean receipt / fee × 100 | 165.26% | 25.37% |
Case C: buffer 2% of the account, gross withdrawal 2%
In dollars: Moneta buffer $1,000 and withdrawal $1,000; Company F buffer $400 and withdrawal $400.
Swipe the table sideways to see both companies.
| Measure | Moneta $50,000 · USK-applied $71 | Company F · standard $20,000 · displayed $129 |
|---|---|---|
| Model mean return ratioMean total cash / fee × 100 | 330.52% | 53.47% |
| Expected total cashIncludes zero | $234.67 | $68.97 |
| Net after feeMean total cash − one fee | +$163.67 | −$60.03 |
| Fee-recovery probabilityModel probability, not observed | 13.33% | 10.71% |
If you stop after the first receipt, the mean net result is +$46.33 for Moneta and −$94.71 for Company F. In Case C, even stopping after the first receipt gives a positive mean for Moneta and a negative one for Company F.
Case C: see the stop-after-first-receipt figures
| Measure | Moneta | Company F · standard |
|---|---|---|
| Mean receiptFirst only; includes zero | $117.33 | $34.29 |
| Net after feeMean receipt − one fee | +$46.33 | −$94.71 |
| Mean return ratioMean receipt / fee × 100 | 165.26% | 26.58% |
How to read this comparison
- Where Moneta is lower: the purchase fee (USK-applied display $71 vs $129; a conditional displayed amount) and the evaluation target as a share of the account (3% vs 9%).
- Where Company F is wider or better: the normal maximum loss before first reward approval is 3% of the account vs Moneta's 2%, the daily loss allowance is 3% vs 1% of the account, and the reward share rises from 80% for the first four approved rewards to 85% for the fifth and 90% from the sixth. The model includes that rise.
- The maximum-loss allowance in dollars looks larger for Moneta ($1,000 vs $600), but only because its account is 2.5 times larger. Account size scales the cash amounts, while the probabilities depend on ratios such as loss allowance to target. The larger dollar amount is therefore not counted as an independent probability advantage.
- Net after fee is the mean total cash minus one purchase fee. The mean return ratio is mean total cash / fee × 100; it is not an annual return or a return on the nominal account balance. Because the sizes differ by 2.5 times, each result combines account size, fee, targets, loss allowances and reward split, and does not isolate an effect of the brand itself. The markets also differ, and nothing here guarantees that either is better in practice.
- A, B and C are separate examples. No figure averages the three cases, and none represents a typical outcome.
- Recovery probability counts the minimum number of receipts whose cumulative cash covers the fee. In Company F's Case A one receipt does not cover the fee, so two receipts are needed and the probability includes the next continuation, not only reaching the first receipt.
- In this unlimited model the account eventually stops with probability 1. Simulated balances that were never withdrawn are not counted as cash.
Payout routes in Case A
- Moneta: gross withdrawal $250, cash $220. That exceeds the $100 Crypto minimum but not the $500 Rise minimum. The $100 figure is the Crypto payout guide's minimum, not a minimum for all services.
- Company F: gross withdrawal $100, cash $80. That clears the $50 minimum checked and retains a 1% buffer ($200), but covering the $129 fee takes 2 receipts ($80 × 2).
- This is not an eligibility waiver. Which amount (before or after the split) a minimum applies to, and review and approval, are separate conditions to check on the actual request screen.
Formulas
- D = initial loss allowance, T = evaluation target, B = retained buffer, W = gross withdrawal.
- Evaluation pass probability q = D / (D + T). Purchase-to-first-receipt probability p = q × D / (D + B + W). Continuation probability r = B / (B + W).
- Moneta: mean total cash = p × W × 0.88 / (1 − r).
- Company F: mean total cash = p × W × (0.8 × (1 + r + r² + r³) + 0.85 × r⁴ + 0.9 × r⁵ / (1 − r)).
- First-receipt-only mean = p × W × first-receipt share. Mean return ratio = mean cash / fee × 100.
The idea of taking profit earlier
Taking profit earlier can raise the probability of recovering the fee, but it can also reduce mean receipts. Changing where you stop moves both, so look at the probability and the mean together; there is no guarantee that both improve. Withdrawing all profit and closing the account on purpose, and how the daily loss line is handled at withdrawal, are unverified, so this is not presented as an operating recommendation.
Moneta's $71 is the amount shown on its pre-purchase selector on November 8, 2026 at 23:07 JST after applying the USK code, conditional on eligibility. We do not promise the code is currently active or state when it expires, and neither was verified. Company F's fee and its 3% standard maximum-loss rule were checked against its current public pricing on November 9 (Japan time). These are dated records: no purchase or checkout was made, and the final total including taxes and payment fees is unverified.
What carries over from the Blueberry calculation article?
The Blueberry Instant Elite calculation article (Japanese) likewise separates first-receipt probability, conditional continuation, mean total receipts including zero outcomes, and the probability of recovering the fee. We use the same distinctions here. Expected receipts divided by the fee, called a theoretical payout ratio there, is neither the recovery probability nor the net return after fees.
The assumptions differ: that historical-campaign model starts without an evaluation and assumes unverified fixed post-payout downside of 4% or 7.5%. Daily includes an evaluation, and after first approval its remaining buffer is retained profit above the initial-balance loss floor. Profit splits and account counts also differ, so the headline ratios are not a like-for-like product ranking. The Moneta comparison in that article concerns Instant Pro, not 1-Step Daily.
8. What trading approach fits? Start with the loss budget
Separate the buffer before and after a payout
This article has no trade-level evidence establishing an optimal instrument or entry setup. Start by checking whether your existing method has an edge after costs, then size it to Daily’s small loss allowances. A positive result under assumptions does not establish a real trading edge.
For example, on $100K, $100 planned risk per trade (0.10% of initial size) and a self-imposed −$200 daily stop would stop well before using the full normal $1,000 daily allowance. This is a risk-management illustration, not an official requirement or safety guarantee. Include spread, commissions, slippage and correlated positions, and first check the actual remaining daily and total room on the dashboard.
If the buffer after approval is $1,000, the same $100 risks 10% of that remaining room. Reassess size using both initial account size and remaining loss capacity, rather than automatically keeping the pre-payout lot size. Retaining more profit gives more room to continue but also raises the profit needed before the first request.
Check after-cost trade expectancy and compliance
Assuming a 45% win rate with a 1.5-to-1 reward/risk payoff gives 0.45 × 1.5 − 0.55 = +0.125 risk units per trade before costs. Evidence for that 45% is still needed. Widening a profit target does not establish that the same win rate will hold.
Practical checks come first:
- The general news restriction covers opening and closing within five minutes before or after a red-folder release, including TP and SL execution. Check the affected events and exceptions such as closing a position held for more than two hours beforehand.
- Check balance and equity around the 22:00 UTC reset, or 07:00 JST the next day. Overnight and weekend holding may be allowed, but gaps and reversal of floating profit can still create daily-limit risk.
- Do not base the plan on adding to losers or increasing size to recover losses. Aggregate risk across the account, symbols and trade ideas.
- Check EA and copying restrictions. Copying has conditions such as the same owner and Moneta accounts; copying from another firm or freely using commercial EAs and signals is not generally permitted.
The official rules prohibit statistical exploitation and gamification of the program. Do not use the hypothetical model above as an execution plan for those practices. Daily request opportunities do not require trading every day or withdrawing the maximum every time. Official news rules / Official copying rules / Official prohibited methods
9. Who might find it suitable?
It is a candidate for traders who want a single evaluation and already have risk management compatible with the 1% daily and 2% normal total limits. Those who want no qualifying-day or best-day percentage requirement, or a short Funded payout-request cycle, may also value its structure.
Be more cautious if your strategy needs large floating-loss room, concentrates on major news releases, or assumes that all profit can be withdrawn while the original loss buffer remains available. Check the instruments, sessions and position sizes you actually trade.
10. Frequently asked questions
Can I use a Funded account immediately after reaching the target?
Further checks, agreement and review can still be required. My post reported successful login after checking and completing the agreement step. It does not guarantee the same sequence or timing for everyone.
Does daily payout mean same-day receipt?
No. Request eligibility, review, processing and receipt are separate. The official usual processing estimate is 24–48 business hours.
Did USK receive a payout in this record?
The evidence covered here concerns target achievement and the later Funded-login report. It contains no payout request or receipt-of-funds evidence.
Is this Instant Pro?
No. 1-Step Daily has an evaluation phase. Instant Pro is a different product; its loss limits and payout schedule should not be applied to this account.
Conclusion: worth considering if fee and a 3% target matter most
1-Step Daily is a plan with one evaluation phase and a 3% profit target, after which you can request rewards daily when eligible. It does not mean passing in one day or receiving cash every day. There is no minimum-profitable-days or consistency rule, but the key points are managing the 1% daily and normal 2% maximum-loss limits, and how much buffer you leave in the account after the first reward is approved.
Against Company F’s standard account, Moneta came out lower on both purchase fee and evaluation target under the conditions checked. At the nearest offered sizes, Moneta $50K and Company F $20K, the discounted displays are $71 versus $129 and the evaluation targets are 3% versus 9%. These are not the same size or market, and Company F’s loss allowances are wider as a share of the account. The $71 is the USK-code-applied display on November 8, 2026 at 23:07 Japan time; current eligibility and the final amount are unverified.
In the hypothetical A–C calculations, Moneta also had the higher mean receipt, mean net after the fee and mean return ratio. In the model that repeats until failure without a time limit, the mean return ratios are about 212–331% versus about 32–53%. The “payout-ratio style” figure is mean total receipts / fee × 100 (percent); it is not a probability, actual performance or the share of people who recover the fee.
These calculations assume 50/50 wins and losses, no costs and every request approved, and how the daily loss line is adjusted at a payout is unverified. Some paths lose the fee before any first receipt, and Case A stopped after the first receipt has a negative mean net result. A high mean return ratio alone does not mean buying is a good deal.
Even so, for readers who want a lower purchase fee, a single evaluation phase and a short reward-request cycle, I think it is a plan worth comparing. My record runs from reaching the target to Funded login and does not yet include a payout. Once you have checked that your usual method fits the 1% daily limit and that you can try it with a fee you could lose without affecting your daily life, please use the USK referral link below to check the eligible accounts, the code conditions and the final amount.
Related reading: My Propr evaluation-to-Funded record (Japanese) and the Instant-product article featuring Moneta Phoenix and Instant Pro (Japanese).
This is an individual account record and informational review, not investment advice or a guarantee of passing or receiving rewards. Conditions may change. Check current official information and your account agreement before purchasing.